
– Nikhil Naik
Transcript from TEDx Beacon Street November, 2015
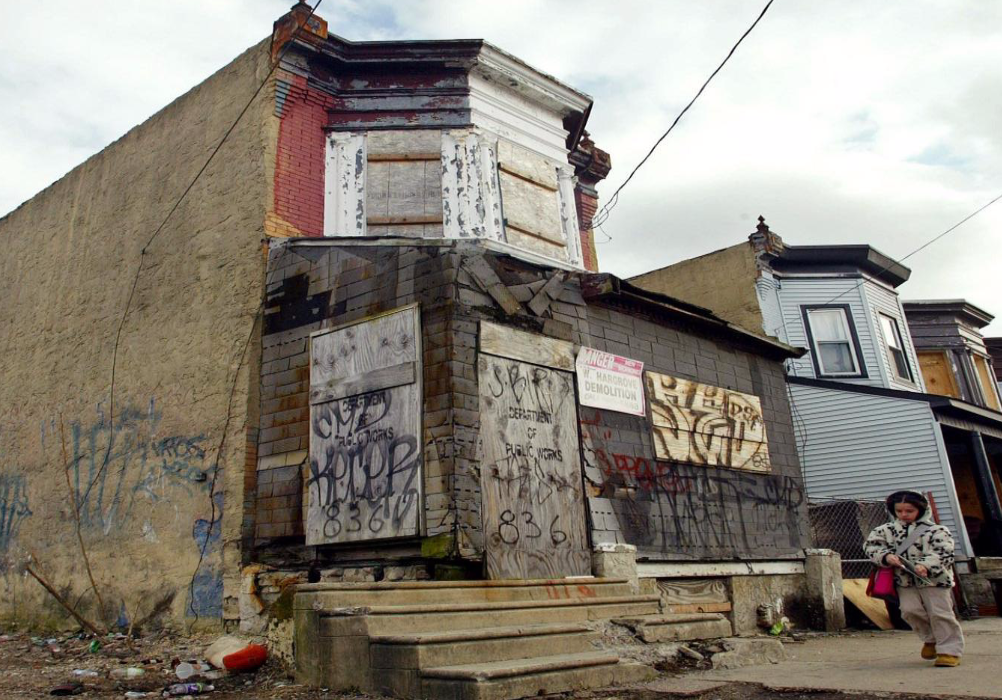
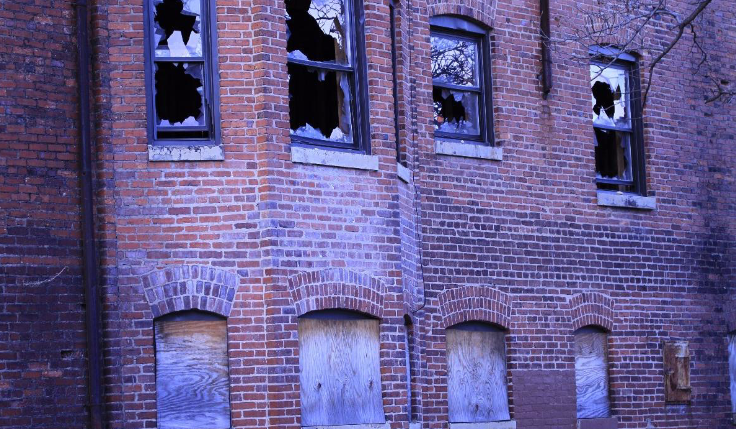
Here we see a picture of a little girl walking to school in one of the many rundown neighborhoods in America. The windows are boarded up. The walls are filled with graffiti, and there is trash on the street. It makes you wonder how living in this neighborhood affects her life, her health, or her performance in school. It makes you wonder if the windows were cleared, if the trash was cleaned, would her life be any better – even if she had the same family and the same school.
Social scientists have grappled with the following question for more than a century. How does the appearance of a neighborhood affect the people who live there? Inspired by the famous broken windows theory studies have linked neighborhood appearance to criminal behavior. Similar studies have shown that neighborhood appearance affects even health, mobility, and school dropout rates.
These studies are limited in the scope due to a lack of data on how cities look. At the moment, the researchers spend many months doing field surveys to measure how neighborhoods look but the field surveys can only cover so much area. They are limited to a few neighborhoods and a handful of cities at most. So, how do we increase the speed and the scale of these field surveys? The solutions is to replace people surveying streets with computers looking at images from Google Street View.
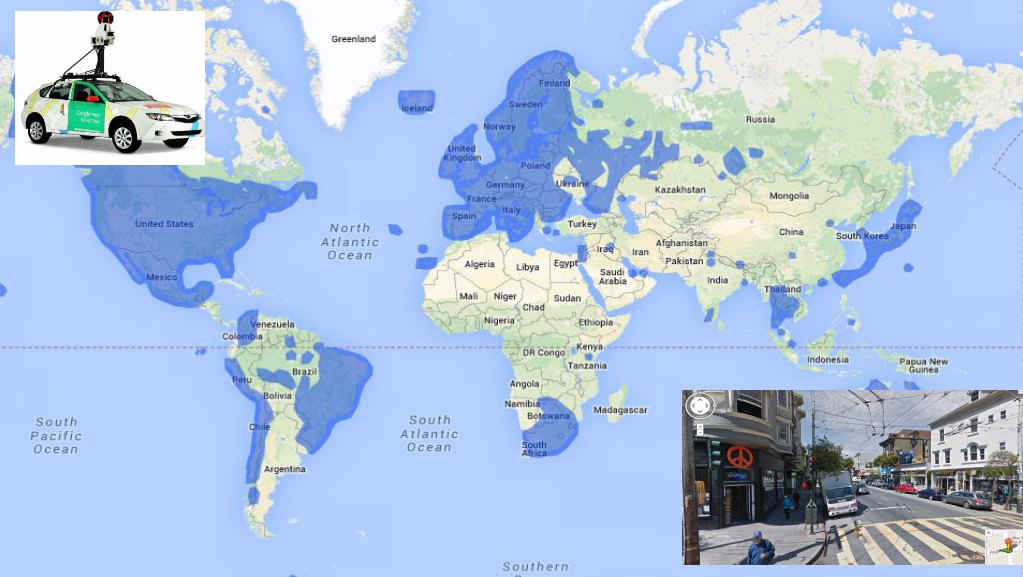
In the past decade, more than 3,000 cities from 91 countries have been photographed by Google Street View alone. It is now possible to virtually field survey many, many cities without leaving your home. Specifically we want to teach the computer to be able to look at a picture of a street block and tell us how safe it would look to a human observer. We can do this using machine learning.
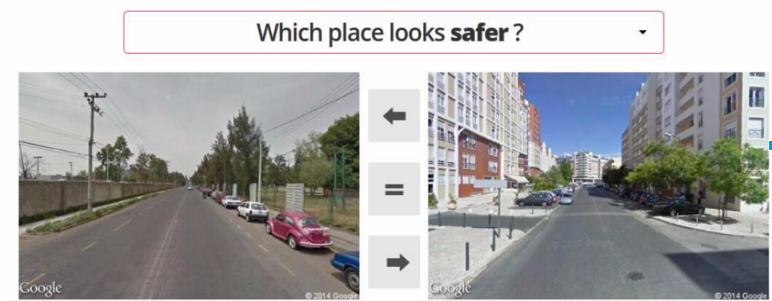
In machine learning, the computer learns to do a task from examples. The first goal is to create examples of how safe street blocks look to humans. To get these examples, we created an online game called Place Pulse. In this game, we show people images from Street View side by side, and ask them to choose one which looks safer. This game was online for about four months. It went viral. We had 3,000 images from New York and Boston. Eight thousand participants from more than 90 countries played this game and we received more than 200,000 clicks on the site.
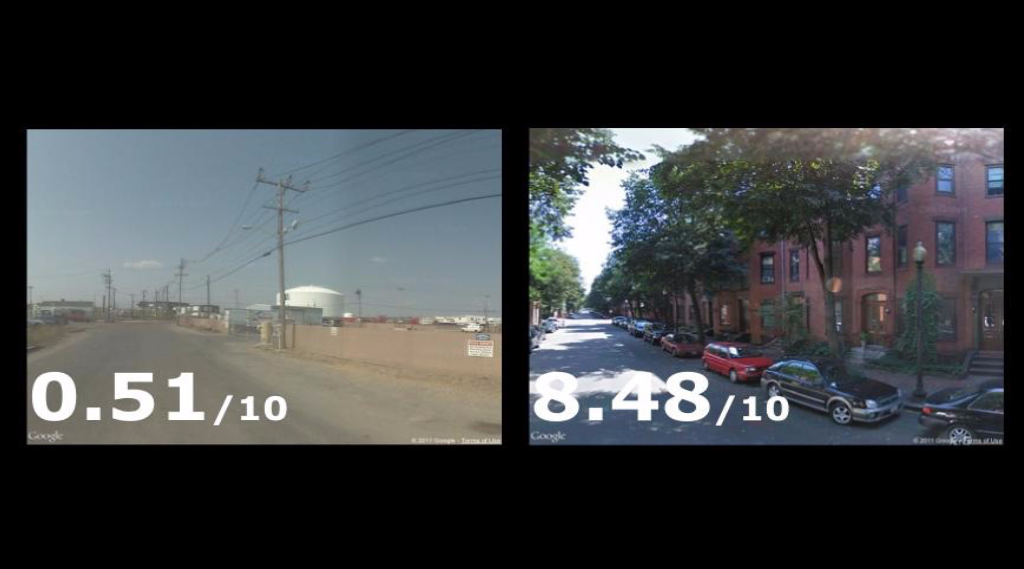
Now we can take these clicks and assign scores between zero and 10 to images based on how safe they look. The higher the score, the safer the image looks to a majority of our users. We call this score Streetscore. Now that we have these examples, we can train the computer to do this task. The computer learns from the shapes, textures, and colors present in the image and learns to assign a score to a new image it has never seen before.
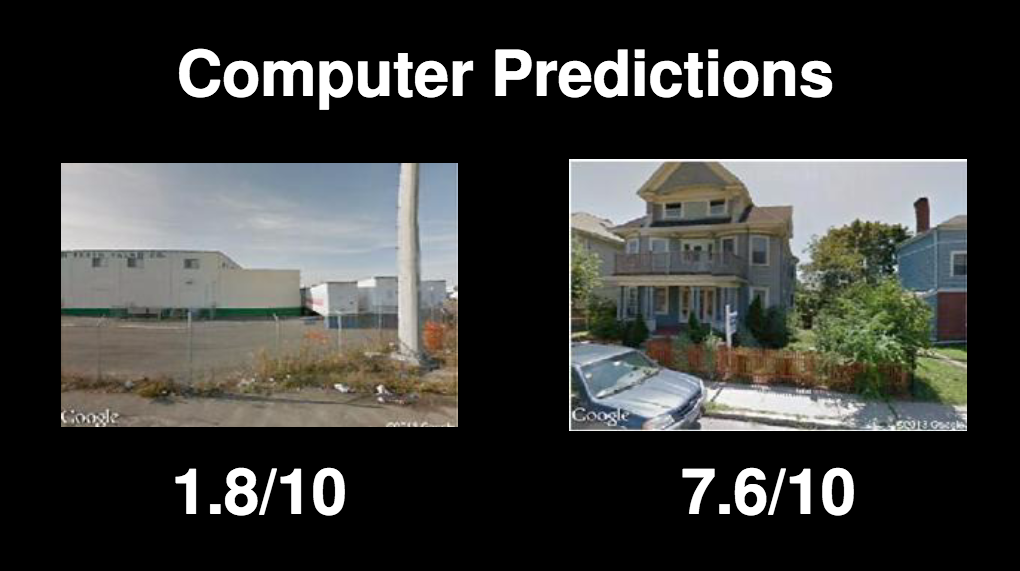
The computer is quite good at it. It assigns low scores to street blocks that have empty streets, rundown buildings, and industrial warehouses. On the other hand, it assigns a high school to suburban houses with manicured lawns and clean streets lined with trees.
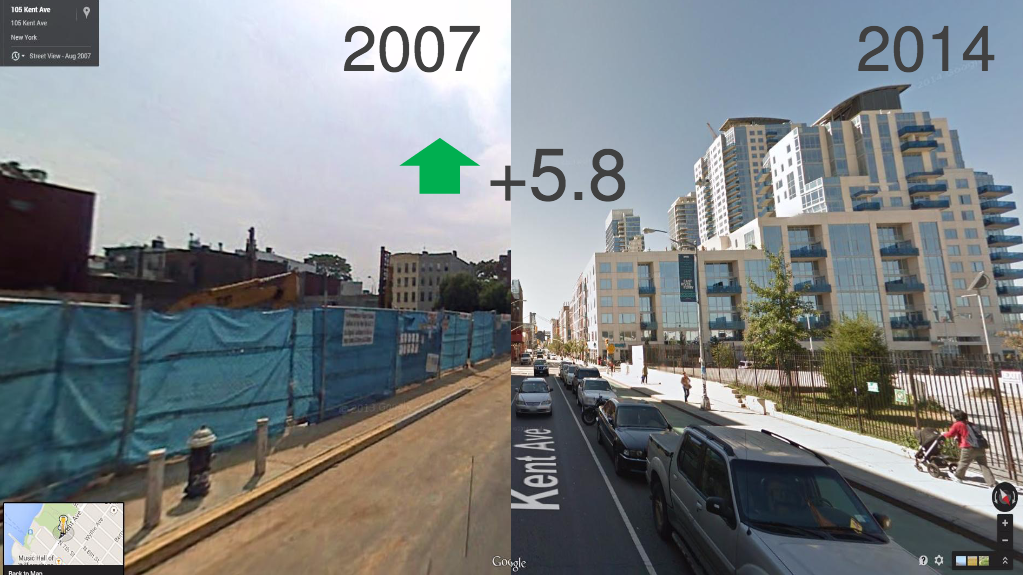
Not just that, we can look at the same location and take pictures from two different times and study how the place has changed. We can do this by simply taking the difference of the streetscore of the place at two different times. This can be used to identify places undergoing gentrification or decline, which is very important at the moment in cities.
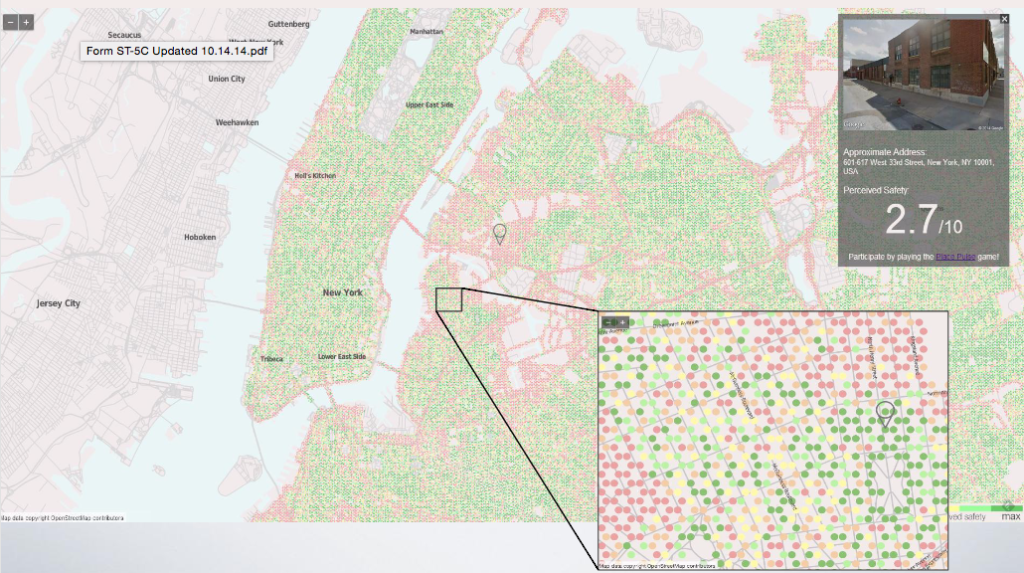
So, we use streetscore to calculate the perception of safety of more than 2 million street blocks from 21 American cities to create the largest database of how cities look. We can use this data to create incredibly detailed maps of how neighborhoods look, like this map of New York City. Now researchers across the country are using our data to measure how neighborhood appearance impacts your health, crime, mobility, and education.
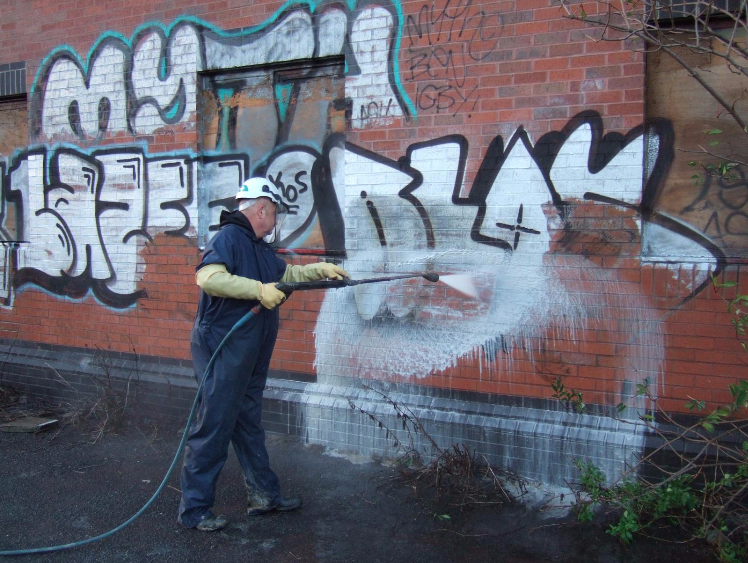
This tool is useful to city governments as well. City governments spend millions of dollars trying to clear graffiti, fix sidewalks, and plant trees to improve their neighborhoods. Streetscore can help them make data-driven decisions on how the roads look and assign the resources accordingly. Streetscore can also help them to measure the impact of neighborhood improvement initiatives by using images before and after a neighborhood fixup.
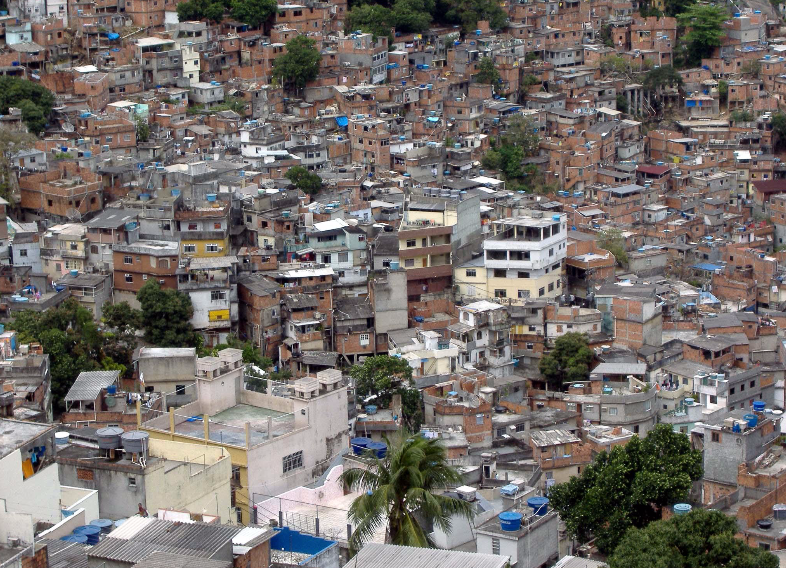
Tools that can use computers to measure city appearance are even more useful in developing countries. The governments like the resources to measure the condition of their cities. As they say, what you cannot measure, you cannot understand. What you cannot understand, you cannot improve.
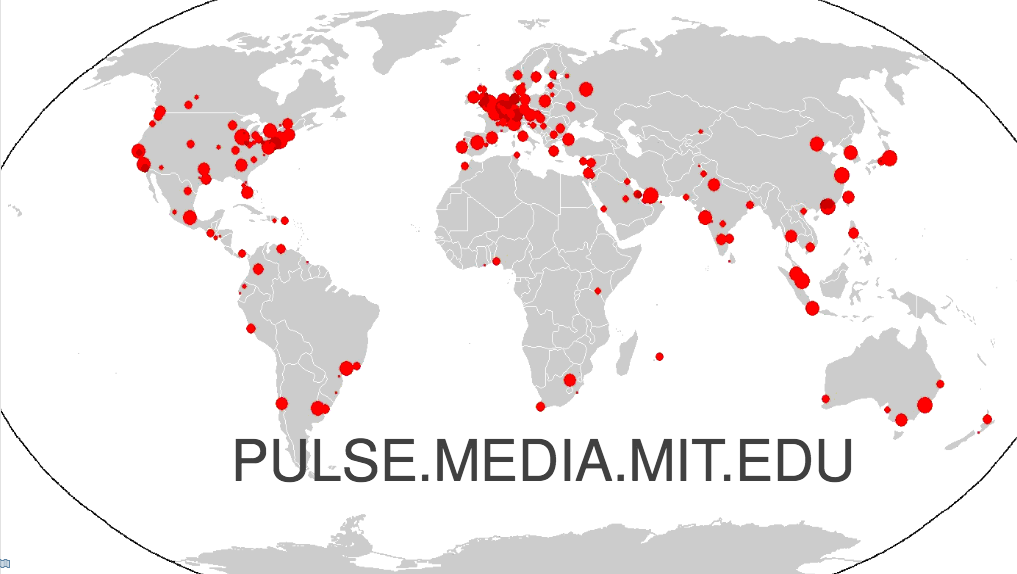
Now, our goal is to teach the computer to be able to look at the pictures from a city in a developing country and make inference about it. To be able to do so, we created a new game that has images from 56 countries across six continents. More than 200,000 people have played this game so far and contributed 1.3 million clicks, but we need more data. We invite you to visit this website and help us play the game.
My work with streetscore is helping improve our understanding of how neighborhood appearance impacts people. It is also helping us to study gentrification, and decline of cities. In the long run, big visual data and machine learning can help us improve the life of more than 3.5 billion people who live in cities across the world.
We need data! Play the game: pulse.media.mit.edu/
See safety ratings: streetscore.media.mit.edu/
Read the paper: macro.media.mit.edu/papers/streetscore_paper.pdf
 Nikhil Naik is a PhD student at the MIT Media Lab. He is interested in computer vision and computational imaging. His recent work focuses on understanding cities using computer vision. His research has been featured in The Atlantic, The Economist, The Guardian, and Harvard Business Review, among others. He is also a decent ping-pong player.
